This report will review the historical performance of the Dow Jones Industrial Average over the last 20-years. The Trader’s Brief studies focus on two key classifications:
· Calendar Studies; and
· Technical Studies
Calendar Studies find tendencies related to specific dates of a calendar month. Technical Studies focus on things such as: Was the high of the month higher than the previous month or was the low of the month lower than the previous month. With that in mind lets dive into the historicals for this month, which will be broken down the into 5-year, 10-year and 20-year periods.
Calendar Studies
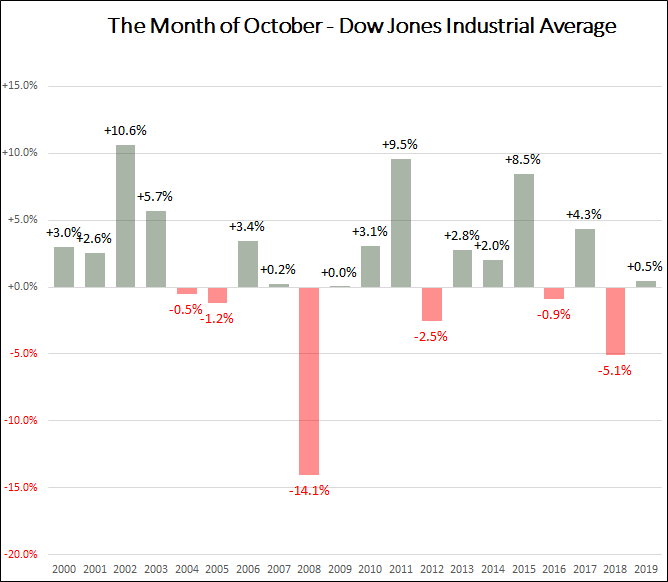
Price change for the Month & “What If Study”
Change in price over the 5-year, 10-year and 20-year periods reflect an Up+/Down- ratio of: +3 / -2, +7 / -3 and +14 / -6 respectively. Not all months are created equal. If the month was Up+ it had different characteristics than if the month was Dn-. Moving to the “What If Analysis”, we find that “If” the change in price for the month was Up+, the average gain was +4.0%. Conversely “If” the change in price for the month was down, the average decline was -4.1% with an overall change in price of +1.6%.
Below you will find a graph highlighting the change in price over the previous 20-years. Download the PDF version to see a full compilation for the same 20-year period.
Monthly Range
Over the previous 20-years the average monthly range has been 8.9%. Digging a little deeper, the average high above the monthly open has been +4.2%. The average low below the monthly open has been -4.6%. Over the course a month, ranges or highs/lows that extend past these percentage levels can often lead to a reversal in price.
High and Low of the Month
Below you will find a table which represents the number of instances in which the high or low of the month occurred on each workday of the month (PDF version only). A workday is defined as a trading day which can only be on weekdays Monday-Friday.
Technical Studies
Technical Studies focus on price action during the month. Comparing these studies to a 100-yard dash, think of them as measurements of what happens over the course the race instead of only measuring the finish line. A lot goes on before the end of the race. Ratio’s that lean to the upside favor intramonth bullish action, and ratios that lean to the downside favor intramonth bearish action. With that in mind let us look at how the Dow Jones Industrial Average has performed over the same 20-year period. The Trader’s Brief technical studies revolve around three key studies: Target Study, Percent Levels Study and High / Low Study.
Target Study
The Target Study is based on 3 standardized targets for both upper and lower price action and measures the instances in which upper and lower targets have been reached during the month. Looking at our standard 5-year, 10-year and 20-year periods, the upper+ vs lower- target study reflects a ratio of: +5 / -5, +10 / -10 and +15 / -19 respectively.
Percent Level Study
The Percent Level Study is a measure of intramonth price movement reaching predefined percent levels of 2%, 4% and 6% in either direction, Up+ or Dn-. Our standard 5-year, 10-year and 20-year periods reveal a higher+ vs lower- instance ratio of: +5 / -5, +12 / -12 and +27 / -24 respectively.
High Low Study
The High / Low Study is a measure of intramonth price movement that rises above the previous month’s high or declines below the previous month’s low or both. Our standard 5-year, 10-year and 20-year periods reflect an instance ratio of: +3 / -3, +8 / -6 and +12 / -11 respectively.
Combined Technical Studies
Combining all three of the technical studies, we can get an overall feel for what the intramonth price action may look like irrespective of the month being Up+ or Dn- by the end of the period. Our standard 5-year, 10-year and 20-year periods reveal an upper+ vs lower- combined instance ratio of: +13 / -13, +30 / -28 and +54 / -54 respectively.
Make the Trader’s Brief Almanacs part of your daily trading plan. Available for all Indexes, Stocks, ETF’s and Futures. Contact us with any questions at contact@thetradersbrief.com or visit us at thetradersbrief.com to subscribe.